D8PSK
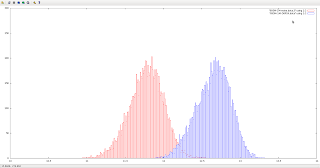
A D8PSK signal generated by benchmark_tx.py was tested first.
First, the noise + signal/noise plot:
The plot of probability of false alarm (Pfa) and probability of detection vs. threshold value:
Finally the ROC curve.
Now that the basics are in place we can look into gathering more meaningful results.
Complex Sinusoid - Lower power
A complex sinusoid signal was generated using usrp_siggen_gui.py with the following parameters:Amplitude: 660u
TX gain: 6 dB
Complex Sinusoid - Higher power
Amplitude: 94M
TX gain: 7dB


Can you share the code for Pfa and Pd and How did you calculate the ROC curve ? One more question... Have you done this offline or in real time ? I ask this because the graphs are plotted using pylab.
ReplyDelete